Every instrument has a resolution limit — the smallest difference it can actually detect. Push past it and the readout keeps producing digits, but the digits stop carrying information. This summer the industry's most-quoted coding benchmark crossed that line in public, and almost nobody noticed: the two biggest labs published scores 0.1 points apart, the internet spent a week declaring a winner, and the information content of the comparison was zero. This post is about how to tell when a benchmark number is measuring a model — and when it's measuring everything around the model instead.
One Tenth of a Point, Zero Bits of Information
You've seen the screenshot. Claude Opus 4.8: 88.6 on SWE-bench Verified. GPT-5.5: 88.7. One tenth of a point, cropped, circled, and reposted all summer under the same caption: GPT edges out Claude. Here's what the screenshot won't tell you: that gap is not a result. It's an artifact.
Those two numbers were never in the same race. Anthropic's 88.6 averages 5 trials over all 500 Verified tasks — its system card says so — on the company's characteristically minimal scaffold: a bash tool and a file editor. OpenAI's 88.7 is a launch-announcement figure on its own internal scaffold, with its own averaging. And OpenAI's last documented SWE-bench protocol, a footnote in the GPT-5 system card, reads: "All SWE-bench evaluation runs use a fixed subset of n=477 verified tasks which have been validated on our internal infrastructure." Not 500. 477. Score those 23 skipped tasks as failures — the way they'd count against a model that attempted all 500 — and 88.7 deflates toward 84.6.
Anthropic's experiment:   500 tasks, 5-trial average, max effort, minimal scaffold
OpenAI's experiment:      477 tasks "validated on our internal infrastructure",
                          4-try average, bash + apply_patch, custom scaffold
Headline gap:             0.1 points
Subset headroom alone:    up to ~4.6 points (23 tasks × 0.2)  →  up to 46× the gap
One known error source — the task subset alone, before we touch scaffolds or trial averaging — can be forty-six times larger than the difference everyone argued about.
When one error source can be 46× the delta, the delta is not a finding. It's noise wearing a headline's clothes.
The tell sits in Anthropic's own comparison table. Its stated policy is to draw competitor figures from published system cards and leaderboards — and it happily prints OpenAI's 58.6 on SWE-bench Pro. On the SWE-bench Verified row, where 88.7 should be: a dash. The most-screenshotted number of the summer did not clear the rival vendor's own sourcing bar. If the competing lab won't cite the number, stop using it to resolve a 0.1-point difference.
The Harness Is Worth More Than the Model
Terminal-Bench 2.1 hands you about as close to a controlled experiment as any public leaderboard gets: same model, same tasks, two different agent harnesses. Swap the scaffold and watch the number move.
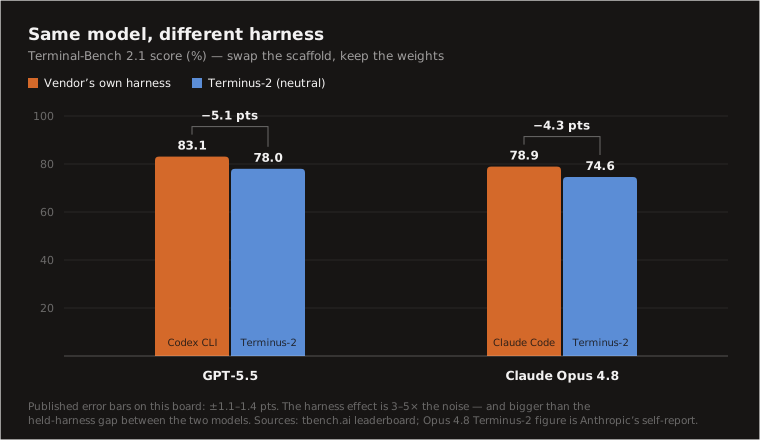
GPT-5.5 inside OpenAI's own Codex CLI scores 83.1; the identical model inside Terminus-2, the neutral harness, scores 78.0. That's a 5.1-point swing from scaffold engineering alone — prompts, tool definitions, retry logic, context management. Not one parameter changed. And it's not an OpenAI quirk: Opus 4.8 pulls the same trick in the other jersey, 78.9 in Claude Code against 74.6 in Terminus-2. Every model on the board with both entries scores meaningfully better inside the harness its own lab built.
Hold those swings against the published error bars — ±1.1 to ±1.4 points — and the harness effect is three to five times the statistical noise, and bigger than the held-harness gap between the two flagships themselves. Do the decomposition honestly: native-vs-native, GPT-5.5 leads Opus 4.8 by about 4.2 points, and that's the number that gets quoted. Fix the harness at Terminus-2 and the model-only gap shrinks to ~3.4 — as little as ~1.8 if you take vals.ai's independent Terminus-2 run of GPT-5.5 (76.4) over tbench.ai's 78.0. GPT-5.5's terminal-agent edge is real and survives normalization; somewhere between a fifth and half of the headline, though, belongs to Codex CLI's engineering team, not to the weights. And note that last pair: two serious leaderboards running nominally the same experiment disagree by 1.6 points. Reproduction drift alone is the size of the error bars.
SWE-bench Verified Is Saturated, and OpenAI Just Told You So
A benchmark works when models spread out on it. Look where they sit in July 2026:
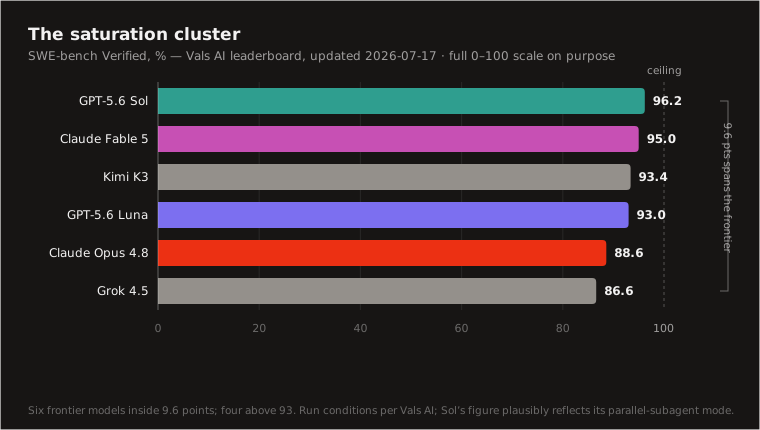
Four models packed above 93. That's not a leaderboard anymore; that's a crowd pressed against a very low ceiling. (One caution: vals.ai doesn't publish run conditions, and Sol's 96.2 plausibly reflects its parallel-subagent mode — read the board as directional. Directionally, it's damning.) The ceiling arrived fast, too: Opus 4.5 scored 80.9 in November, 4.7 hit 87.6 in April, 4.8 sits at 88.6 — nearly eight points in one Opus generation, six months.
Now do the arithmetic that kills the benchmark. From 96.2, the entire runway to a perfect score is 3.8 points. The harness effect we just measured runs three to five. The benchmark's remaining headroom is about the size of the noise floor of how you run it. Past that point, Verified isn't measuring who fixes real GitHub issues better. It's measuring who tuned their scaffold last.
A benchmark stops being a benchmark the day its headroom shrinks below its harness variance. Everything published after that day is decoration.
The labs already know. GPT-5.6 Sol — OpenAI's current flagship, GA July 9 — shipped with no first-party SWE-bench Verified score at all, and dropped GPQA Diamond, AIME, and MMLU with it. Nobody writes "Sunsetting SWE-bench Verified"; retirement is a silent deletion from the launch table. One vendor stopped publishing the figure; the other stopped accepting it (that dash). The benchmark didn't get refuted — it got abandoned by both parties mid-handshake. Even Opus 4.8's GPQA "regression" (93.6, down 0.6) drew a correct shrug: a sub-point delta at 94% measures sampling variance, not science knowledge.
The Benchmarks That Still Pick Winners Are the Ones Nobody Headlines
The lazy conclusion — "benchmarks are all noise, trust the vibes" — is exactly as wrong as trusting the headline. Discrimination didn't die; it moved, off the saturated leaderboards and onto the ones nobody puts in a launch tweet, where the gaps run 8 to 23 points — several times the scaffold effects and error bars above. (Framing note: Opus 4.8 vs GPT-5.6 Sol is the like-for-like matchup — $5/M-input flagship workhorses, 1M-class context — but neither is its vendor's absolute frontier; OpenAI's own launch charts benchmark against Claude Fable 5.)
| Benchmark | Opus 4.8 | GPT flagships | Gap | Provenance |
|---|---|---|---|---|
| SWE-bench Pro | 69.2% | 64.6% (Sol) / 58.6% (GPT-5.5) | 4.6–10.6 pts | Anthropic's run vs OpenAI's own published numbers |
| GraphWalks BFS @ 1M | 68.1% | 45.4% (GPT-5.5; no Sol score) | 22.7 pts | Both from Anthropic's comparison table |
| BrowseComp (single-agent) | 84.3% | 92.2% (Sol) | 7.9 pts, OpenAI's way | OpenAI-authored eval; Anthropic printed its loss |
SWE-bench Pro is what Verified was before everyone memorized it: harder, held-out, headroom left (the published leader, Fable 5, sits at 80). The same two models that "tie" at 88.6 vs 88.7 sit 10.6 points apart here — though treat the 4.6-point Opus-over-Sol edge as a lead, not a verdict; it spans two vendors' harnesses. GraphWalks at a million tokens is the quietly brutal one — can the model actually traverse the full window it sells you? — and the 22.7-point gap is four times any documented harness effect. BrowseComp cuts the other way, and I'm citing it precisely because it goes against the model I've been defending: Sol at 92.2 clears Opus 4.8 and its own predecessor by ~8. Discriminating benchmarks don't crown one winner. That's how you know they're measuring something.
The vendor behavior around these numbers is itself data. OpenAI published Sol's SWE-bench Pro loss while simultaneously publishing an argument that ~30% of the benchmark's tasks are broken. Its Terminal-Bench topline, 91.9, is "Sol Ultra" — a parallel-subagent mode at 2.5–3× the cost that no other vendor's single-agent number can be compared against (single-agent Sol: 88.8). Anthropic, with better production values, buried a real regression — Gray Swan prompt-injection attack success rising from 6.0% to ~9.6% — page-deep in a 244-page system card, and its headline tables compare against 4.7 only, so multi-generation erosion never appears in a single table. Each lab goes quiet exactly where the discriminating number would cut against it. That silence is legible. Read it like data.
The Ten-Second Read
Next time a comparison table crosses your feed, ask four questions, in order, and stop at the first failure.
1. Same n and same task set? If one lab ran 477 tasks and the other 500, stop reading — there is no comparison on the page.
2. Same harness, or at least a named neutral one? Terminus-2 counts. Codex CLI versus Claude Code is a scaffold bake-off — legitimate engineering, but not a model comparison.
3. Is the gap bigger than ~5 points? That's the documented harness effect. Below it, if protocols differ at all, you're reading vendor methodology with a model attached.
4. What's missing — and who benefits from the dash? A dash is not an absence of data. It's a decision, and it always has a beneficiary.
And when you want numbers worth reading, the July 2026 shortlist: SWE-bench Pro for real-repo coding, GraphWalks for long context, BrowseComp for agentic search — gaps that clear the noise floor, with the most honest datapoints being the losses each vendor printed anyway.
For three years a single number could stand in for "how good is the model," because the benchmarks had headroom and everyone ran them roughly the same way. Both conditions are gone. Reading model comparisons in 2026 is closer to reading financial disclosures than a scoreboard: the printed numbers are curated, the footnotes carry the methodology, and the omissions carry the news. The 0.1-point screenshot will happen again next launch cycle. Let it scroll past. The real result will be where it was this time — in the footnotes, in the dashes, and in the numbers that quietly stopped appearing.
Read the dashes first.